- The population Standard deviation is unknown
- The Population which the sample was taken should be normally distributed
- if the population is not normally distributed, then the sample size should be greater than 30
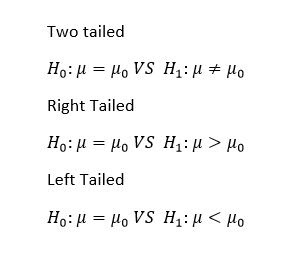
As the first step of the one sample t test, correct hypothesis should be identified.
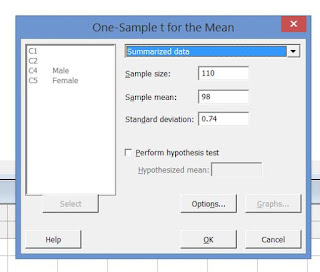
Then to perform a t test in MINITAB first select STAT and then BASIC STATISTICS. In that menu select 1-SAMPLE T. Then the following window will appear.
If you have the sample data, then first type the data in one of the column. After that select one or more samples, each in a column. If you have the summarized data, then select the option summarized data.
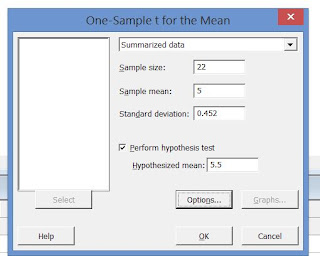
Consider this example . A random sample of 22 fifth grade pupils have a grade point average of 5.0 in maths with a standard deviation of 0.452. Assume the claim is that the average GPA is less than 5.5. Also we are going to test this claim at 5% significance level.So in order to test this hypothesis first data is entered in the MINITAB like this.
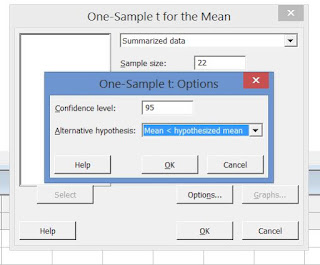
since the claim that going to test is that the average GPA less than 5.5, the value 5.5 has entered under the hypothesized mean. After typing the data, then select the button option.
Since the claim includes the less than keyword, the hypothesis is a left tailed hypothesis. So under the alternative hypothesis, Mean< hypothesized mean should be selected. Then Press OK. Then the results can be seen as the following output.
According to the above output, the test statistic of the t test is -5.19. And the p value is zero and it is less than the significance level (0.05). So the null hypothesis is rejected. So there is sufficient evidence to claim that the average GPA is less than 5.5.


Pretty great post. I simply stumbled upon your blog and wanted to mention that I have really loved surfing around your blog posts. Great set of tips from the master himself. Excellent ideas. Thanks for Awesome tips Keep it
ReplyDeletewintools-net-premium-crack
nch-wavepad-crack
glary-utilities-pro-serial-key
iobit-smart-defrag-pro-crack
hotspot-shield-elite-crack
iobit-malware-fighter-pro-crack
minitab-crack